How To Build An Annual Report In Vev
Forget static PDFs, dry stats, and walls of text—annual reports are now blockbuster pieces of brand content full of rich visuals, interactivity, and storytelling.
Annual reports have increasingly become a site to connect and celebrate relationships with customers, employees, suppliers, and networks, as well as showcase brand personality and vision.
Bottom line—your community is expecting something interesting. Thankfully, with no-code web creation tools like Vev, you don’t need a huge budget or developer resource to build an annual report that looks and feels premium.
To show you just how easy it is, we’ve broken down how to build an interactive annual report in Vev without coding a thing.
The Vev No-Code Components We’ll Be Using
Lottie Animation—Use this element to place a Lottie Animation JSON file anywhere on your Vev canvas.
Charts—Add, customize, and style charts directly on your canvas to display data and build out infographic content.
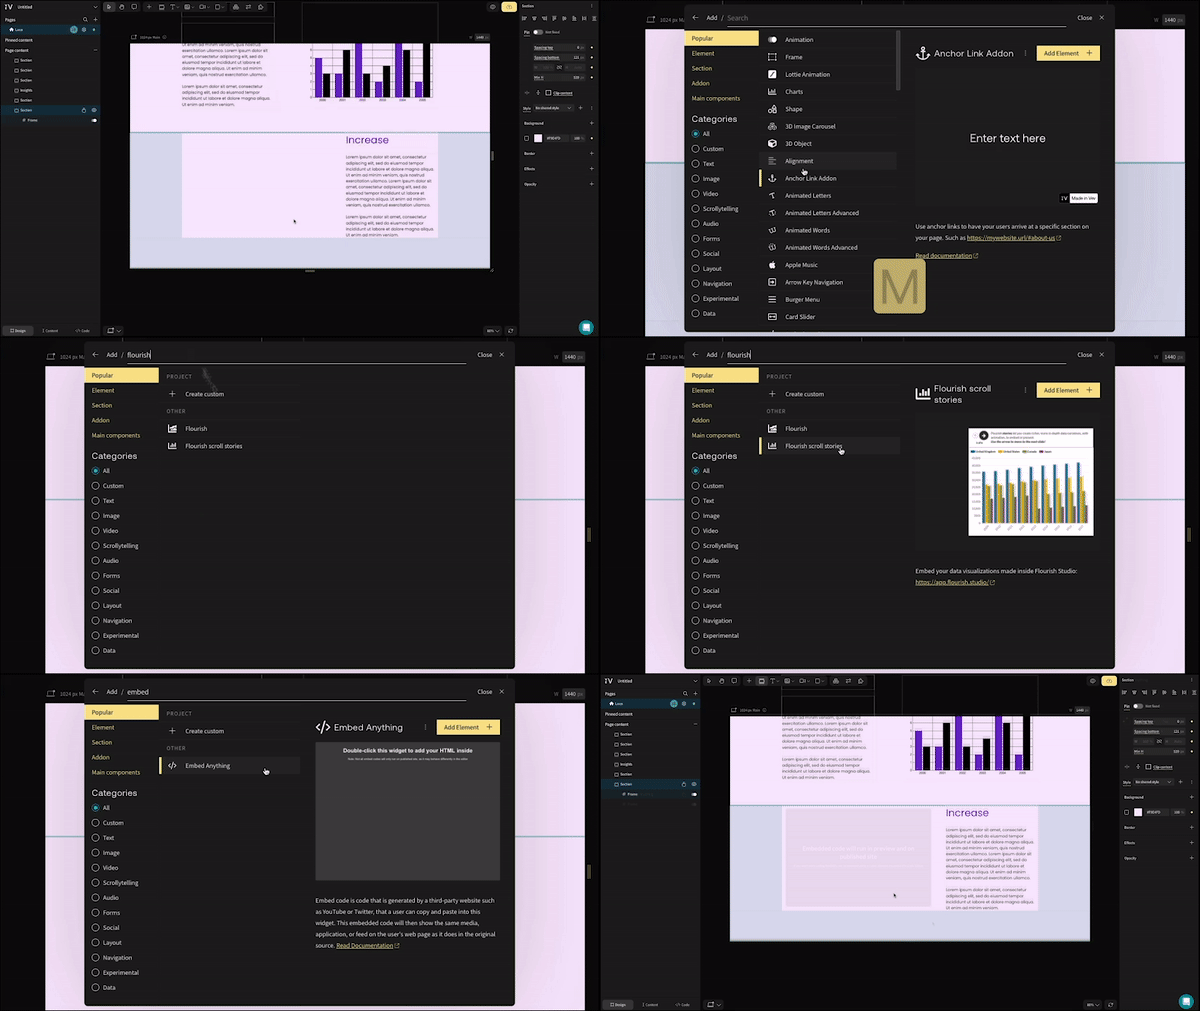
Flourish—Embed your custom data visualizations made with Flourish Studio directly into your Vev project.
Embed Anything—Paste the code from a chart you’ve made in another third-party tool—like Tableau, Sisense, and Datawrapper—into this widget to add it to your Vev design.
Click the eye icon or hit “P” on your keyboard as you design in Vev to preview your work as you go—great for reviewing the flow of your animations and getting a sneak peek at your living, breathing creation.
When you finish your Vev masterpiece, publish it to the web with us or connect an existing hosting to easily add it to your existing website.
Build an Annual Report in Five Steps
Step 1: Create an eye-catching header
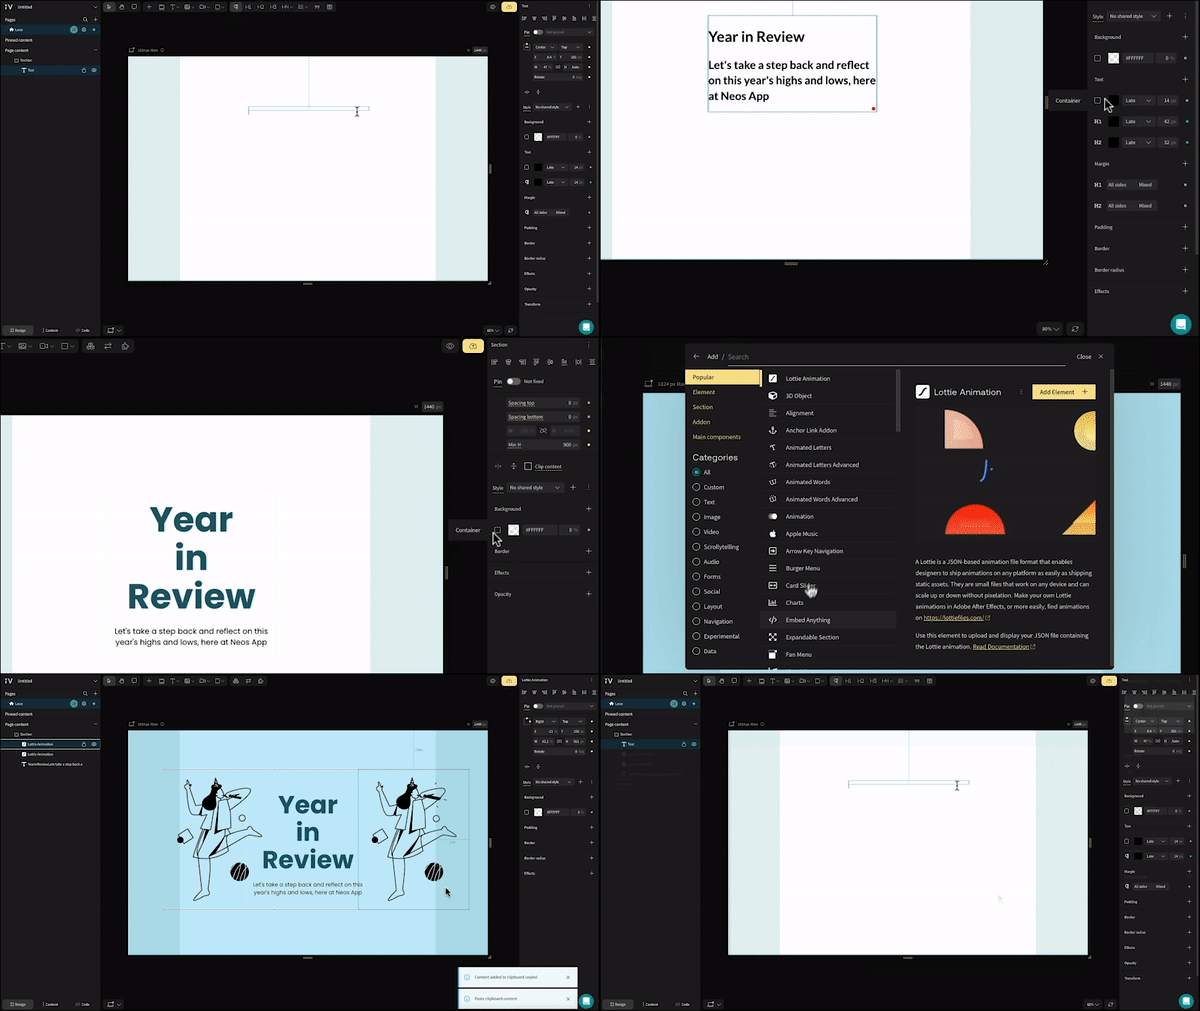
As the first thing your readers engage with, your report header needs to immediately pop. To start, create a new section in Vev (keyboard shortcut: K), then add a text box, insert your report title, and style it with an H1 tag. In the same box, insert a short subtitle as an H2—this should establish the main angle or focus of your report. Head to the style panel on the right to give your header a color.
Now let’s bring it to life with some movement. Hit “M” on your keyboard to open Vev’s library of no-code design components. Search for “Lottie Animation”, then drag and drop it to wherever you want it on your canvas. Click to upload your JSON file—whether it’s one you’ve made yourself in Adobe After Effects, or one you’ve downloaded from a free Lottie Animation library.
Step 2: Pull readers through to your report introduction
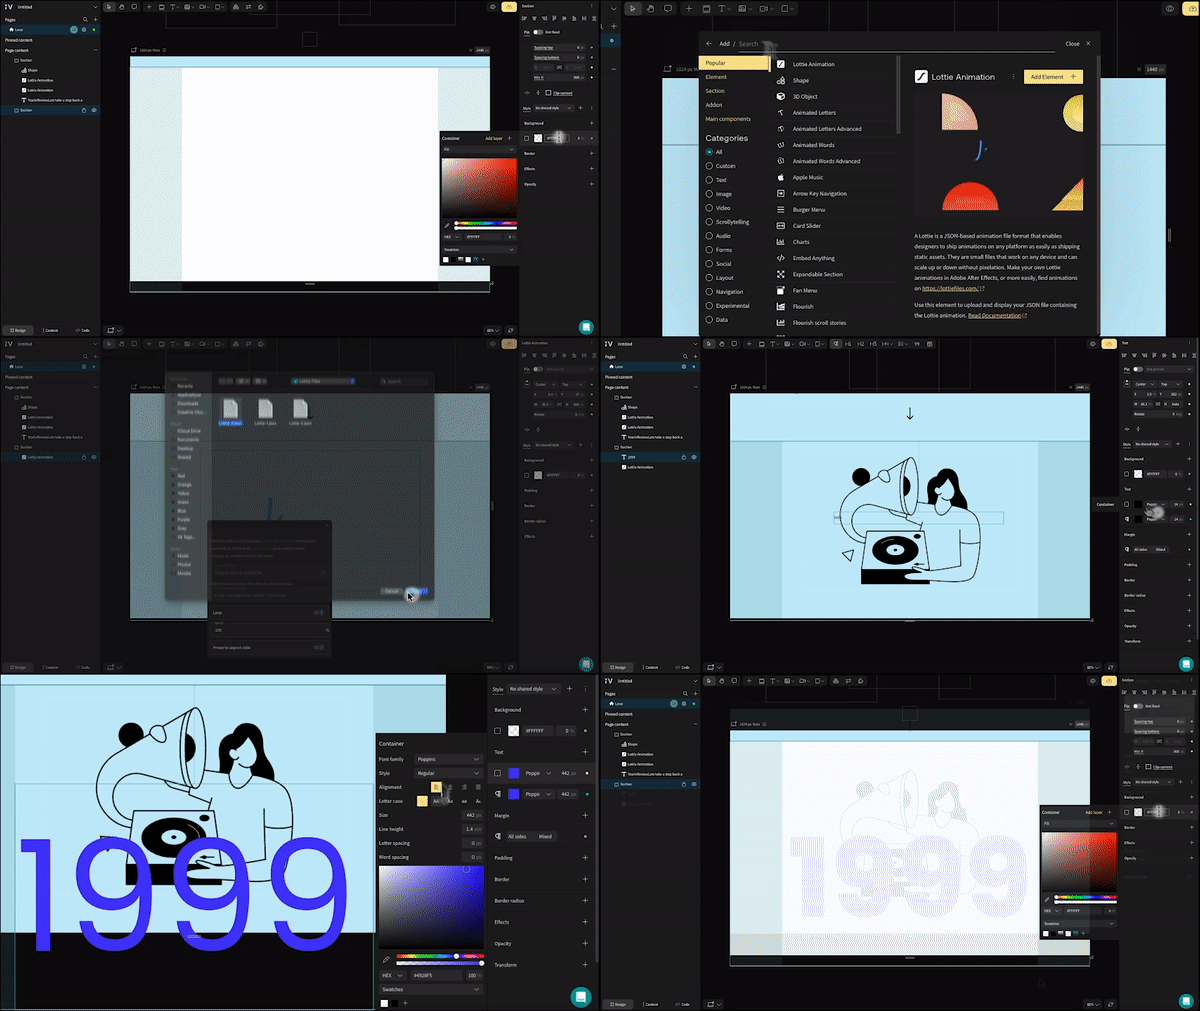
Grab your readers’ attention with this cool trick: add a new section with another Lottie Animation, and overlap the asset with a large “1999” (set as styled paragraph text, since we don’t want this to affect our SEO). Then add another section immediately beneath it and set it to the same color as your text. Butt these two together to get a neat bleed effect—a simple effect to move readers to the meat of your report.
Step 3: Create a story-driven introduction
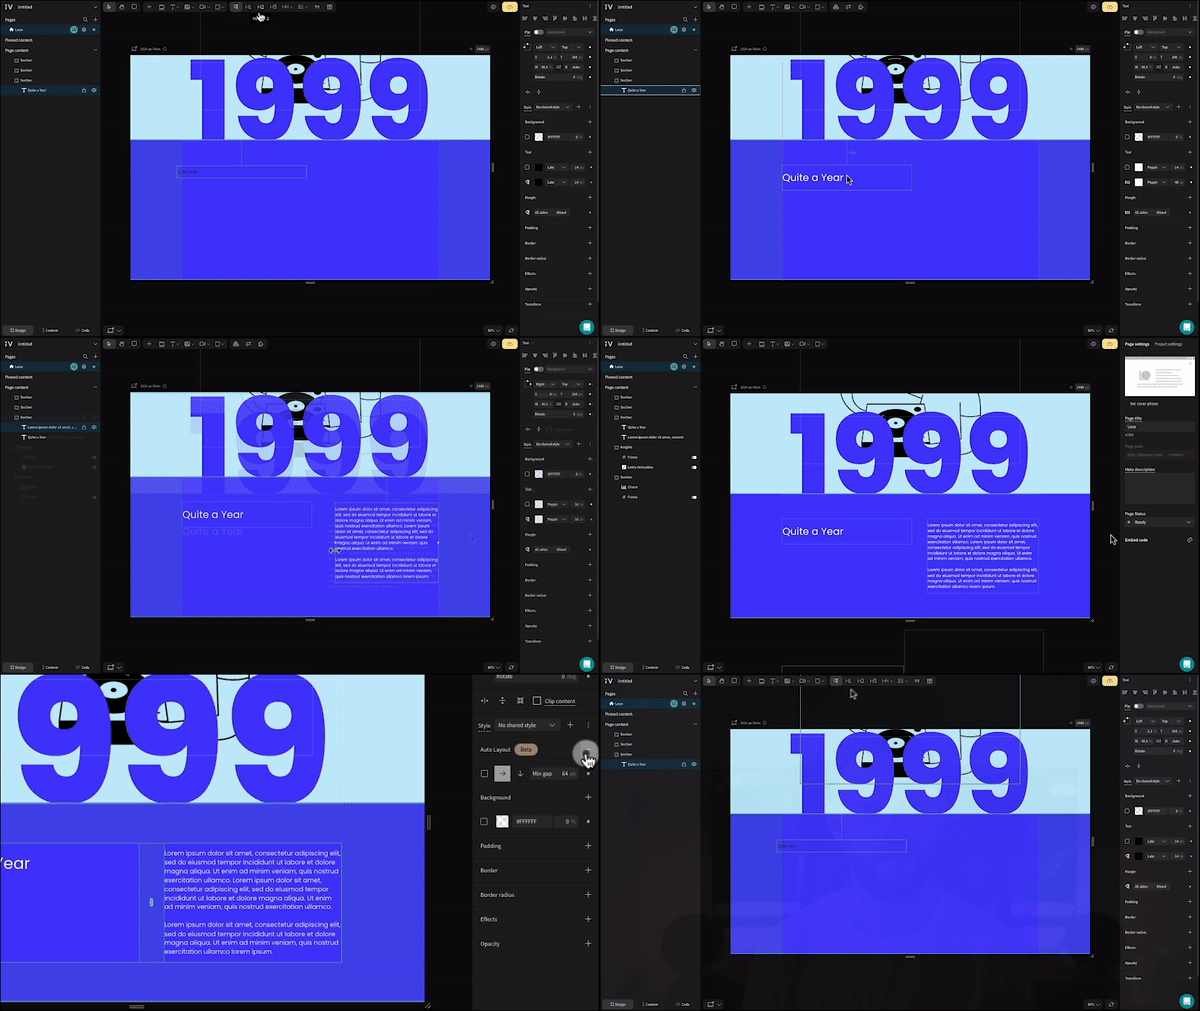
Without introducing the story behind your report, your user will quickly get lost in the numbers and insights you’re about to throw at them— and most likely lose interest. We’re going to change things up by creating two text boxes—one with a H2-styled heading, and the other with paragraph-styled text to set the scene—and sitting them side by side.
To ensure this design works on all devices, select both text boxes and select “auto-layout” from the style panel on the right. Under the property settings, ensure “wrap content” is selected. Auto-layout is a cheeky Vev superpower—great for ensuring designs that involve a lot of cards or grouped images behave as you want them to on smaller screen sizes.
Step 4: Add an animated Vev chart
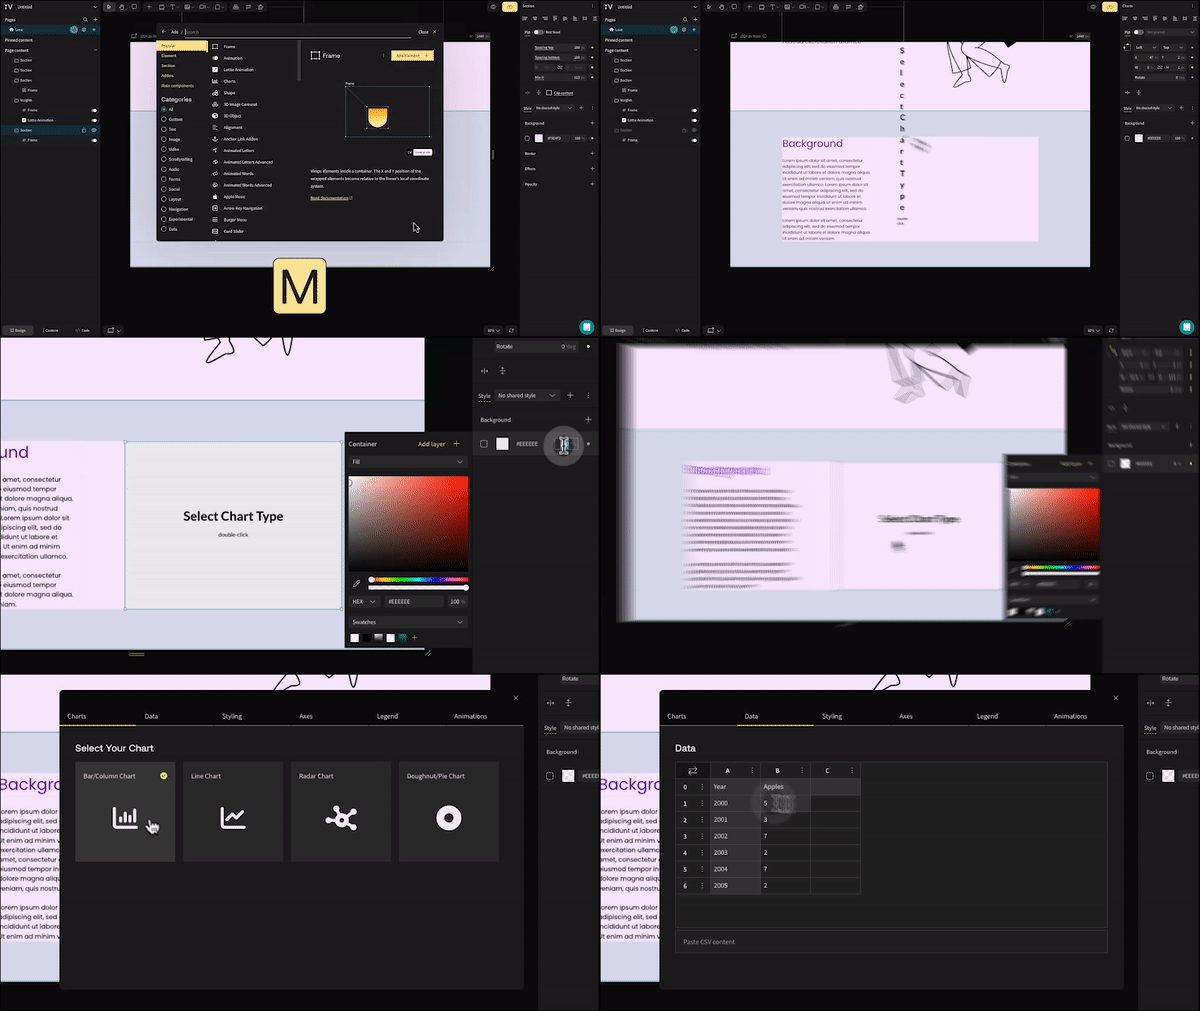
Let’s dive into the data. Vev offers a few ways to weave gorgeous, interactive charts into your design—starting with our very own no-code “Charts” component. Just select this component and click and drag anywhere on your canvas to add it. Double click when you’re ready to start styling your chart—in this case, we’ve gone with a bar chart.
Vev’s “Chart” component lets you upload a .CSV file from an existing spreadsheet, or simply paste data directly into this styling menu. Once your data’s in, you can start styling—changing background color, bar color, border color and radius, and even setting a hover color for when readers move their cursor over your chart on desktop.
From the Axes and Legend tabs, you can customize further—choosing minimum and maximum values, removing the axis grid, customizing labels, hiding your legend, and more. Finally, head to the Animation tab to introduce some slick interactivity: you can animate your chart whenever it comes into your reader’s view, or as they scroll down the page.
Step 5: Add a third-party chart
Use a data visualization to create your charts? Not a problem. If that tool is Flourish, just add Vev’s Flourish element and paste the URL from your Flourish project to seamlessly pull it into Vev. If you use a different data visualization tool, like Tableau, just add Vev’s “Embed Anything” element (side note: you can use this one to embed virtually anything from another tool or existing site into your Vev project—not just charts). Paste your embed code into this element and you’re done—your chart will appear on your canvas.
With these building blocks, you can easily play with a range of interesting visual and copy-driven content to create a winning annual report. There are plenty more no-code design components in Vev’s library (“M” on your keyboard) that you can bring in too.
Annual Reports 101
Discover techniques and best practices for maximizing the impact of your brand’s most important communication.